Monthly Cash Flow
When you look at the list of invoices by year, there is a monthly cash flow graph on top of the list. This graph shows the total invoiced amount per month. You can mouse over any month to see specific figures:
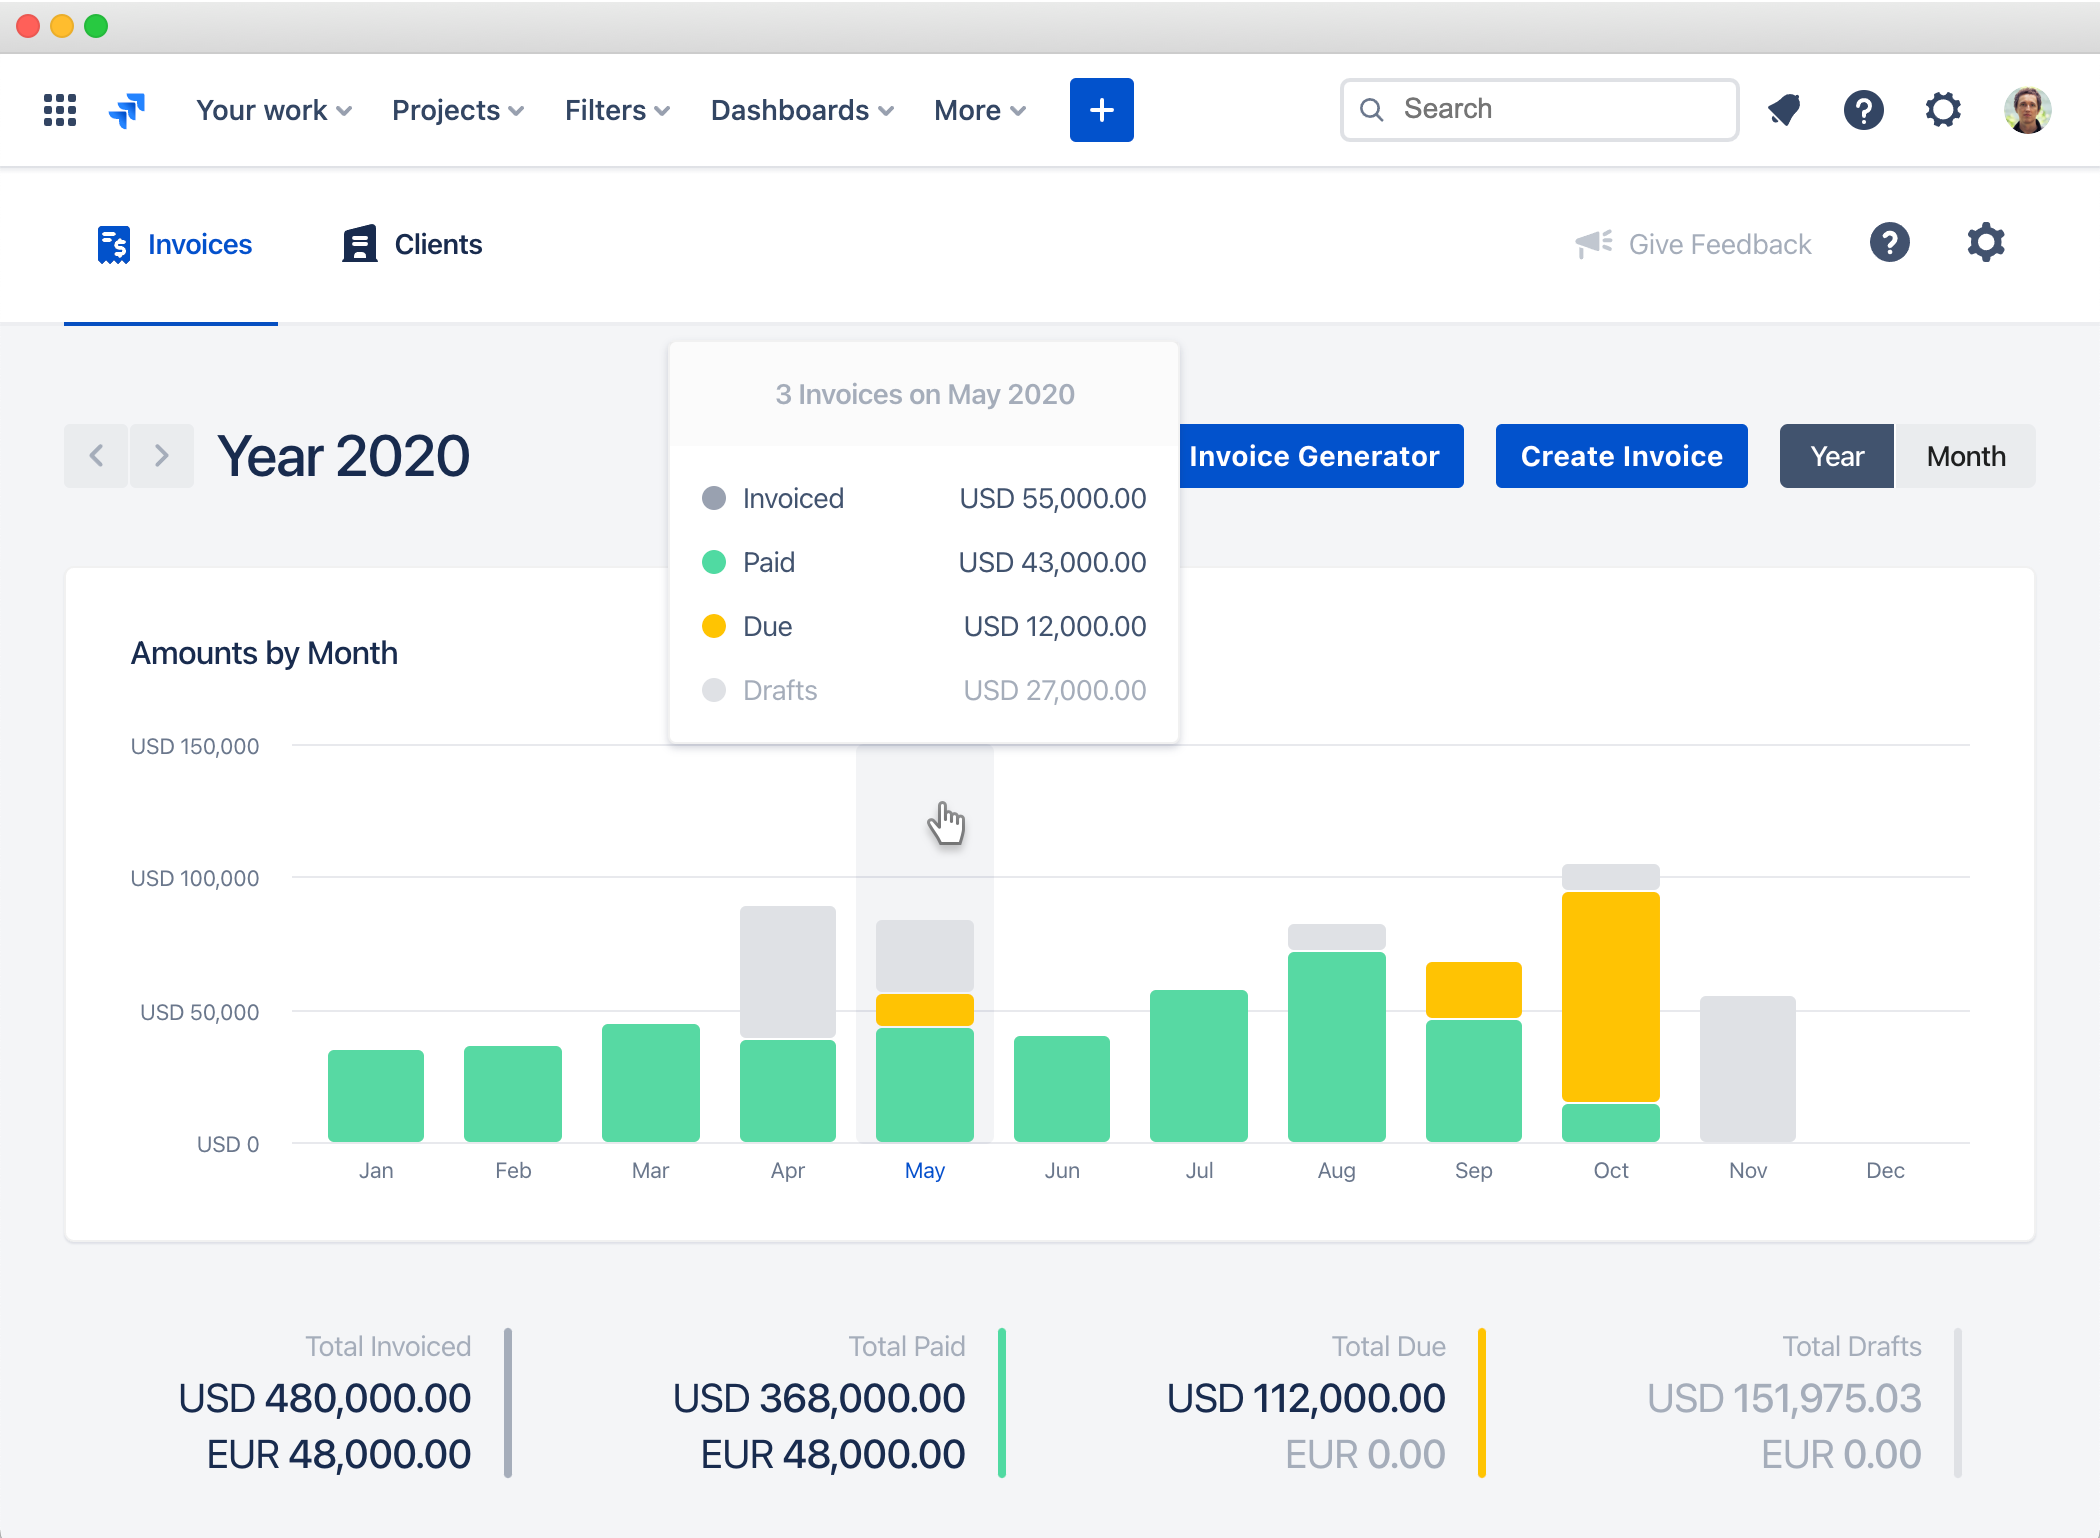
A few points to consider:
- The yellow part of each bar shows the total amount due (the invoices that have Sent status). This is your potential increase in the monthly cash flow if all invoices are paid.
- The green part of each bar shows the total amount paid (the invoices that have Paid status). This is your real monthly cash flow.
- The light grey part of each bar shows the total amount of draft invoices.
- All figures don’t take into account invoices with No Charge status
The chart currency is defined by the General Settings Main Currency.